Index:
Copyright
IntroductionCopyright © 2001 by Frank Cox, frank@pwizardry.com
Permission is granted to copy, distribute and/or modify this document under the terms of the the free documentation license detailed at the bottem of this document.
This site was started in January 2001 to share my weather data visualization knowledge and tool set with other ocean people and programmers. I use tools like these to build my surfing weather site at www.pwizardry.com/buoyPrerequisitesThis will probably be a slow process but I intend to get it all out there eventually. If you want to join this project send email to: openTools@pwizardry.com
My buoyTool tool set is written in Perl and Java. I'll be discussing the techniques I use and including example code written in these languages. To try them out you'll need a working Perl and Java environments to play with. You could just as well implement them in your favorite language. If you do let me know.Tide Tool - A first exampleFor Java, just about any version of the SDK should do. I have lots of older browsers in my user base so I restrict myself to Java 1.0 features. For Perl, try to use a more recent version above 5.0. In addition you'll need to install a few modules that aren't in the standard distribution. Here's a short list:
LWPLWP and Net::FTP
Net::FTP
GD
Time::JulianTime
Note that Net::FTP is included in some versions of LWP or libwww-Perl but not all so you may have to go looking for it.
The LWP Perl library, also known as libwww-perl, is a set of modules for interacting with the World-Wide Web. It's full of great stuff and I make only pedestrian use of it in these tools. The main use of it here is to get weather data files from web sites. I use Net::FTP to get files from FTP servers and put files onto my web site. This could also be done with LWP, but as we say in Perl, TMTOWTDI, "There's more than one way to do it".
GD
The GD.pm Perl module is an interface to a free graphics library in C called libgd and it originally created GIF image files only. When I started putting these tools together in 1998 that was the case and most of the images on my site are still GIF. There's a licensing requirement imposed on programs that create GIF files for commercial use and libgd never acquired one. My site is totally noncommercial so I haven't worried about this myself, but I'm not giveing anyone legal advice here. GD dropped GIF support in favor of PNG in summer 1999. Most browsers support GIF and JPEG images natively but PNG support has been pretty unsatisfactory so I stuck with older versions of GD. Current versions of GD.pm after 1.26 create both PNG and JPEG images so I'm reconsidering my options as I write this. The last version to produce GIF was 1.19. Recent versions of GD are available from the usual sources such as CPAN and for older versions look here.
Time::JulianTime
I use Time::JulianTime to make it easier to work with time and dates. Weather data is collected continually, hour after hour, but the data is tagged with minutes, hours, days, months and years and often in GMT too. There's other ways to do this but using a module like Time::JulianTime to take care of time math means we don't have to think about leap years and the rollover of months or years or centuries. You might think you don't have to worry about the last one but hay, it happened to me! Besides, you might need to deal with historical data sometime.
Tidal changes can be important to ocean people. A certain reef may break, or break you, or do nothing with the same swell, depending on the amount of water over it. Tidal currents can push you right along in some places at some times. Ocean Beach and the breaks in the Golden Gate are like this.For a first example I'll show how to make an automated, custom, daily tide image like the one on my site. Along the way I'll go into extra detail on solutions to some of the common problems that all ocean condition visualization programs must solve. One problem is that data will come from some external source in its author's choice of format. From it we must capture what we need to draw our image. Tide data will come from local prediction software. This means we don't face the problems that missing data causes. That will come up later when we work with buoys and other remote instruments.
Three things need to be done: 1. Get a tide data file, 2. Extract what we want and 3. Create an image.
1. Getting a tide data file: XTide is an excellent tide prediction program for UNIX systems. WXtide32 is the fine port of XTide to Windows that I'll use in this example. You should know that this type of tide prediction program needs a table of harmonic constants for each supported location and that these constants need replacement from time to time. XTide supports over 9,000 locations so you're probably covered. Get a recent version and learn to use it.
To get a file named "temp_tides with 3 days of data for every 10 minutes for the Golden Gate, starting midnight 1/30/2001, I can use this command:
   WXTide32.exe -location "S Francisco, Golden Gate (t)" -24
                -incremental 10 -textfile temp_tides -numdays 3
                -nowarn -gstart 2001:01:30:00:00
Your version of XTide might not work just like this so you probably have to read that docs and experiment. In my experience it takes a lot of trial and error to find right incantation. One tip is that commands can come from a config file if you don't give them explicitly on the command line. For example, I didn't tell it to use feet or Pacific Time. That's OK here but it might also do something that I don't want it to, and that could be very mysterious if I didn't know where to look.In the end you'll want a file of tide heights and times to make the graph you want. In an automated program XTide will be called from a system() command. The only thing we'll need to supply is a date string for the start time in the format XTide wants. That's easy enough to come up with in Perl.
2. Extracting tide data: The first few lines of my temp_tides file looks like this:
   S Francisco, Golden Gate
   Units are feet
   Initial Time Zone is PST

     3.06  0000 01-30
     3.21  0010
     3.35  0020
     3.50  0030
     3.64  0040
There's some text and blank lines that will be ignored and there's columns of data with white space between them and in front of them. Also, it gives time and date in a non-standard format and only gives the date once a day.The following code fragment will take an open filehandle to such a file and create a hash of tide heights indexed to the time in Epoch seconds. The code skips all lines that don't start with zero or more spaces and a number. It then splits apart the data lines and extracts the time and height data. The format of XTide data files is quite varied so the details must change accordingly.
   while (<FILE>) {
      next if not /^\s*\d/;
      ($height, $HrMn, $date) = split;
      $HrMn =~ /(\d\d)(\d\d)/;
      ($hr, $min) = ($1, $2);
      if ($date =~ /(\d\d)-(\d\d)/) {
         ($mo, $day) = ($1, $2);
      }
      $time = timelocal(0, $min, $hr, $day,
                        $mo-1, $year-1900);
      $tideHash{$time} = $height;
   }

   Note: The variable $year is set in the call to XTide.
Since we're dealing with a locally generated file, this is about all that's needed. Data files collected out in nature and downloaded from the net can have messy problems that need cleaning up, as we'll see later. In the finished code I'd bundle data gathering into a function or object that returns a reference for use by other code such as graphing.
3. Drawing the tide image: Now that we have the tide data in a data structure we can create an image file to display it. This is conceptually simple but there are a lot of details to work out. For one thing, you have to decide how you want your image to look. This is a question of design not programming. Here's an example of the tide graph I use on my site:
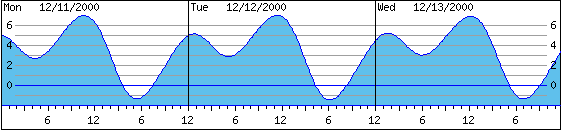
This image is about 560 by 130 pixels in size. There's several elements drawn on top of each other. Starting from the back most: there's the graph of the tide data in blue. This is a filled polygon with a blue outline and a lighter blue fill. The outline consists of straight lines along the bottom and up the two sides and then all the points from the tide height data. The points are joined by straight lines but there are enough to render smooth curves. Next out are the gray lines for the feet markers and black numbers on each end every other line. Then I redraw the zero line in blue. On the top layer there's the black frames around everything. Also in this layer are the day and date text and the time ticks and numbers in the lower frame of the image.
There are 432 elements in the example data set (3 days x 24 hours x 6 per hour). For a 560 pixel wide image that's 1.3 pixels per data point on the x axis. Actually, that gives 561.6 and integer math rounds it down to 561. For the y axis we need to know the range of tide heights at our location. Coincidentally, the example image I used show them about as extreme as they ever get. Minus two feet to plus seven for nine feet total. I use ten pixels per foot. I'll also add 15 pixels on top for the date and 25 on the bottom for the time scale giving 130 total. In a tide graphing program it's helpful to set variables for these sc ailing values. I'll use $scale_x = 1.3 and $scale_y = 10;
In GD The (x,y) coordinate system starts at (0,0) in the upper left corner of the image and gets larger as you go down and to the right. This is the same system used by a lot of graphics and GUI tool kits but it's a bit awkward. Having x increase to the right is fine but y increasing downward takes some getting used to. In the case of our tide graph there's another complication. Tide is measured from a mean low tide height of zero feet and will go up and down from there (mostly up). There can be positive and negative height values. A good strategy is to create a conatant for the y value of zero tide. Then, we subtract the tide height in feet times the pixels per foot value we're using, from the zero tide value. For my example, expressed in terms of $scale_y plus the area set aside for the date string, $mean_tide = 7 * $scale_y + 15. Then, the y value of the tide height can be calculated like this: $y = $mean_tide - (tide_feet * $scale_y)
Here's some code which will take a reference to a hash of tide data like %tideHash created in the above code. It will use that to create an image with the filled polygon graphing the tide heights. It also draws the zero height line and puts in some text to illustrate the technique. For help understanding the GD portion you should look at the excellent pod documentation that comes with the Perl/GD package. (Type "perldoc GD" to see it on any system where it's installed, or look here: http://stein.cshl.org/WWW/software/GD/GD.html .)
   #### Tide_graph ###########################################
   ##

   sub Tide_graph {

      my $tideHash = shift;

      use GD;

      my ($IMG_w, $IMG_h)     = (561, 130);
      my ($scale_x, $scale_y) = (1.3, 10);
      my $mean_tide = 7 * $scale_y + 15;

      my $im   = new GD::Image($IMG_w, $IMG_h);
      my $poly = new GD::Polygon;

      my $white   = $im->colorAllocate(255,255,255);
      my $black   = $im->colorAllocate(0,0,0);
      my $red     = $im->colorAllocate(255,0,0);
      my $blue    = $im->colorAllocate(0,0,255);
      my $lt_blue = $im->colorAllocate(95,192,236);
      my $gray    = $im->colorAllocate(159,159,159);

      $im->transparent($white);
      $im->interlaced ('true');

      $poly->addPt($IMG_w -1, $IMG_h -25);
      $poly->addPt(0, $IMG_h -25);

      my ($x, $y);
      sub numeric { $a<=>$b }
      foreach (sort numeric keys %$tideHash) {
         $y = $mean_tide - ($$tideHash{$_} * $scale_y);
         $poly->addPt($x, $y);
   #     print "$x  $y  >> $$tideHash{$_} \n";
         $x += $scale_x;
      }


      $im->polygon($poly, $blue);
      $im->fill($IMG_w -2, $IMG_h -26, $lt_blue);

      ## make a box around the image
      $im->rectangle( 0, 0, $IMG_w - 1, $IMG_h -1, $black );

      ## draw mean tide line
      $im->line( 15, $mean_tide, $IMG_w - 15,
                 $mean_tide, $blue );

      ## put in text for zero tide...
      $im->string( gdSmallFont, $IMG_w - 10,
                   $mean_tide -7, "0", $black );
      $im->string( gdSmallFont, 7,
                   $mean_tide -7, "0", $black );

      open FILE, "> out.jpg";
      binmode FILE;
      print FILE $im->jpeg(100);
      close FILE;
   }
---
This is a live document and a work in progress.
If you spot errors or want more detail, send mail to
openTools@pwizardry.com
More to come...
License Detail
Permission is granted to copy, distribute and/or modify this document under the terms of the GNU Free Documentation License, Version 1.1 or any later version published by the Free Software Foundation with no Invariant Sections, no Front-Cover Texts, and no Back-Cover Texts. You may obtain a copy of the GNU Free Documentation License from the Free Software Foundation by visiting their Web site or by writing to: Free Software Foundation, Inc., 59 Temple Place - Suite 330, Boston, MA 02111-1307, USA.